
Short-term Earthquake Prediction Based on Seismic Precursory Electric Signals Recorded on Ground Surface.
|
|
“What today seems impossible, is tomorrow’s reality”
Dinos
M 6.9 - TONGA - 2023-07-02 10:27:43 UTC
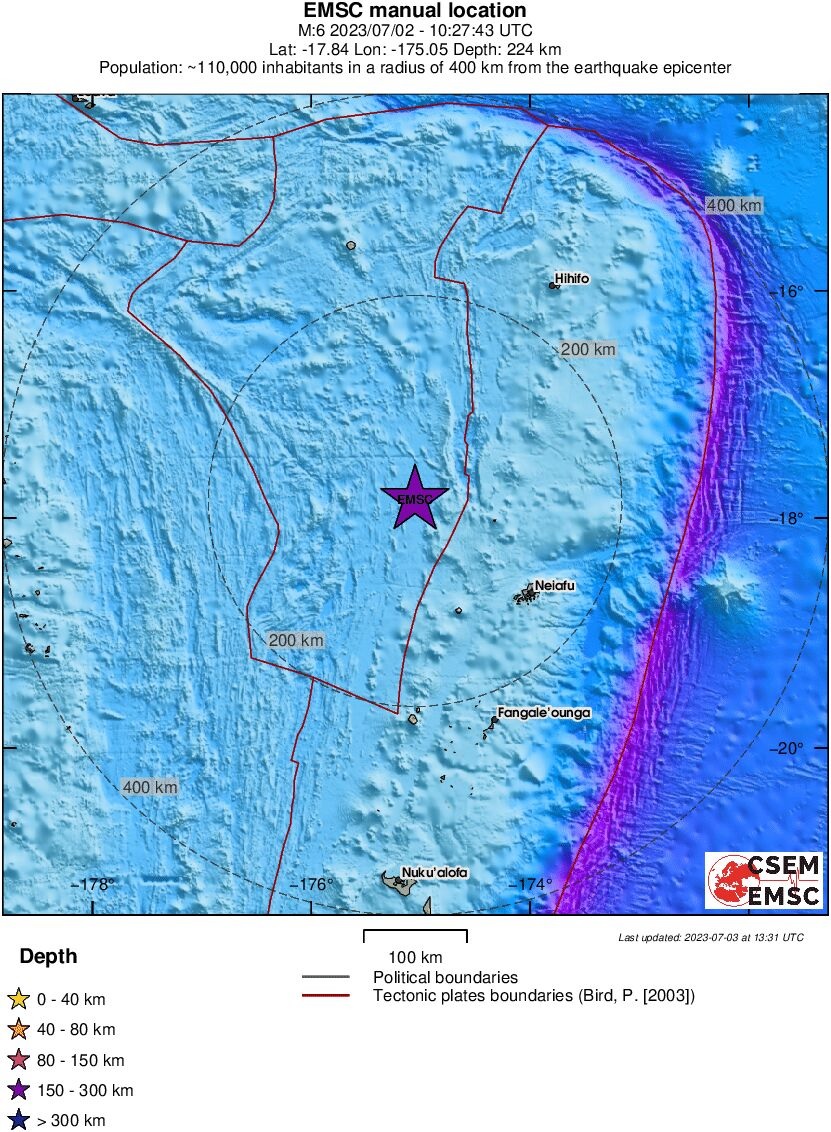
Fig. 1. EQ Location (colored star, after EMSC)
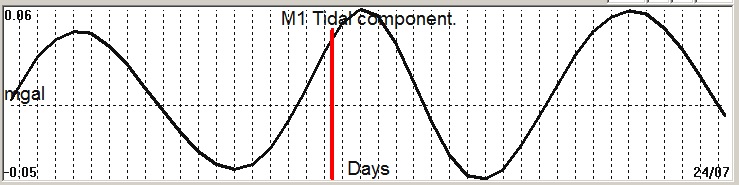
Fig. 2. M1 tidal variation (black line) v.s time of occurrence (red bar) of the EQ.
`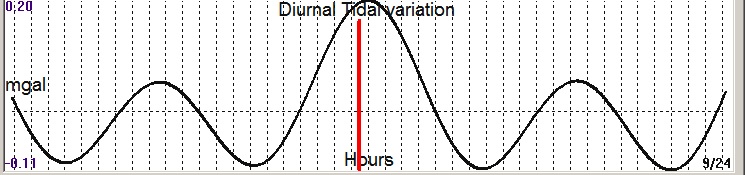
Fig. 3. Diurnal (K2) tidal variation (black line) v.s time of occurrence (red bar) of the EQ.
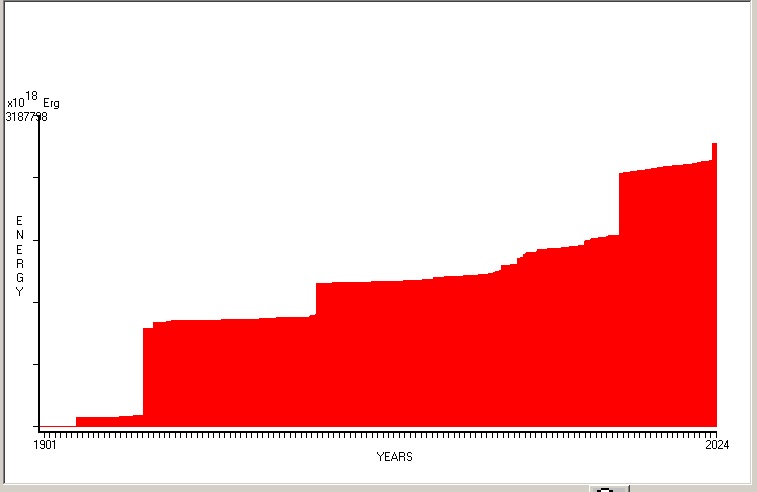
Fig. 4. Cummulative Seismic Energy Release (CSER) since 1901 in 1 month sampling interval.
Fig. 5. Expected EQ magnitude due to application of the LSEFM (Lithospheric Seismic Energy Flow Model) on past (since ----) seismic history of the regional seismogenic area.
Contact us at : gthanding@gmail.com