
Short-term Earthquake Prediction Based on Seismic Precursory Electric Signals Recorded on Ground Surface.
|
|
“What today seems impossible, is tomorrow’s reality”
Dinos
M 6.3 - MOLUCCA SEA - 2021-07-10 00:43:57 UTC
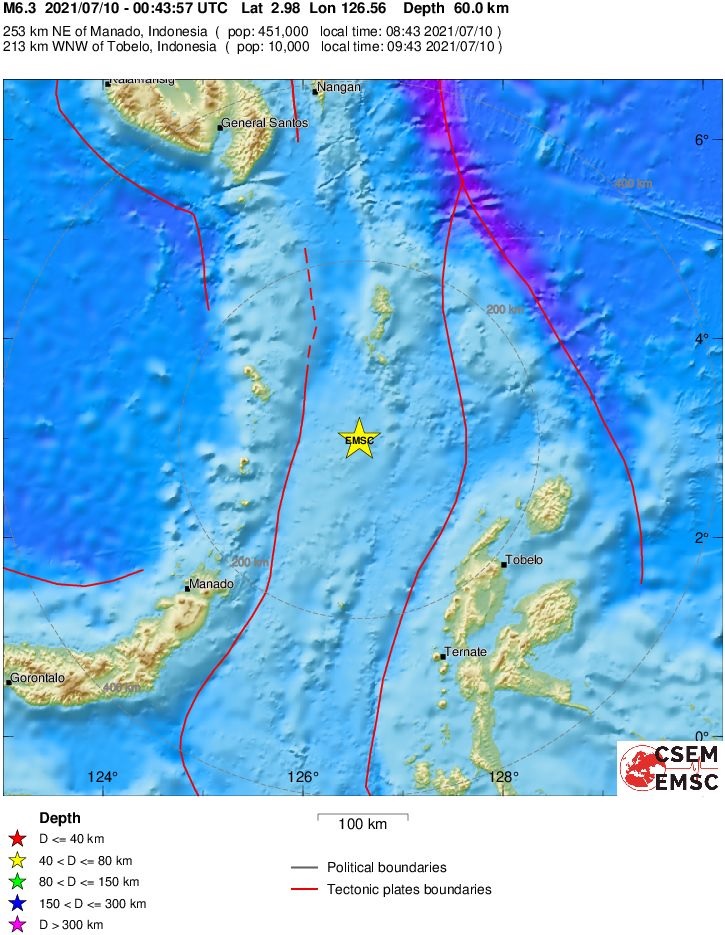
Fig. 1. EQ Location (white star, after EMSC)
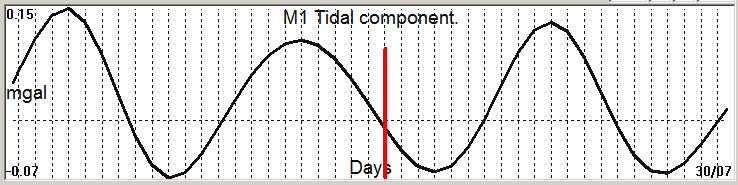
Fig. 2. M1 tidal variation (black line) v.s time of occurrence (red bar) of the EQ.
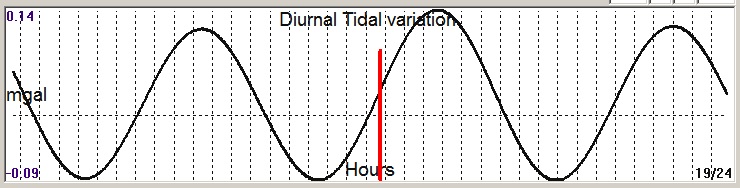
Fig. 3. Diurnal (K2) tidal variation (black line) v.s time of occurrence (red bar) of the EQ.
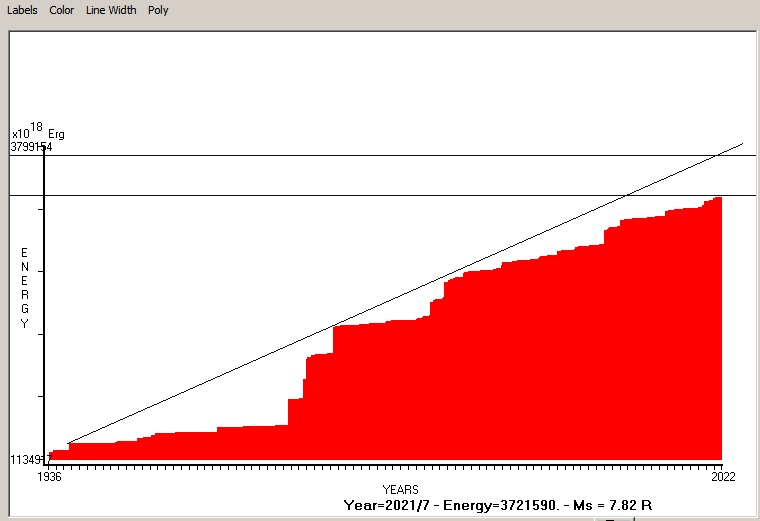
Fig. 4. Expected EQ magnitude due to application of the LSEFM (Lithospheric Seismic Energy Flow Model) on past (since 1936) seismic history of the regional seismogenic area.
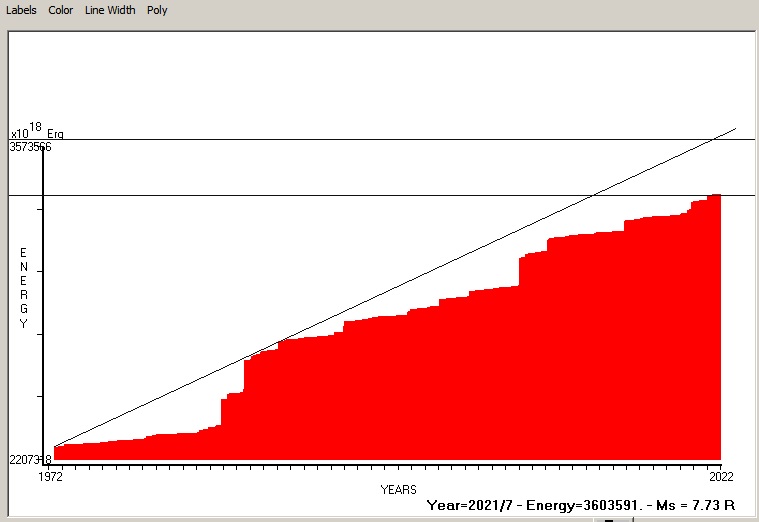
Fig. 5. Expected EQ magnitude due to application of the LSEFM (Lithospheric Seismic Energy Flow Model) on past (since 1972) seismic history of the regional seismogenic area.
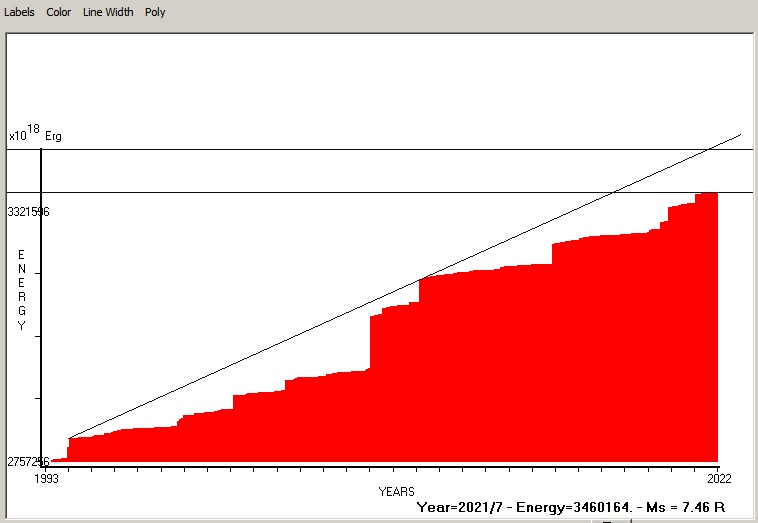
Fig. 6. Expected EQ magnitude d1991o application of the LSEFM (Lithospheric Seismic Energy Flow Model) on past (since 1993) seismic history of the regional seismogenic area.
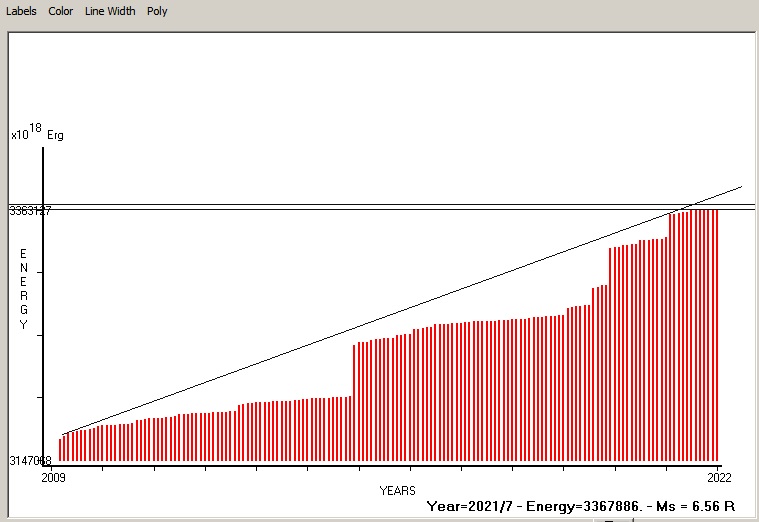
Fig. 7. Expected EQ magnitude due to application of the LSEFM (Lithospheric Seismic Energy Flow Model) on past (since 2009) seismic history of the regional seismogenic area.
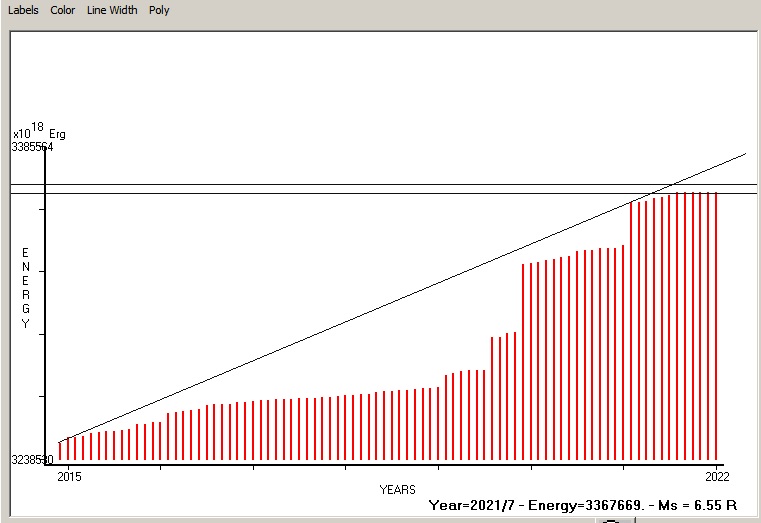
Fig. 8. Expected EQ magnitude due to application of the LSEFM (Lithospheric Seismic Energy Flow Model) on past (since 2015) seismic history of the regional seismogenic area.
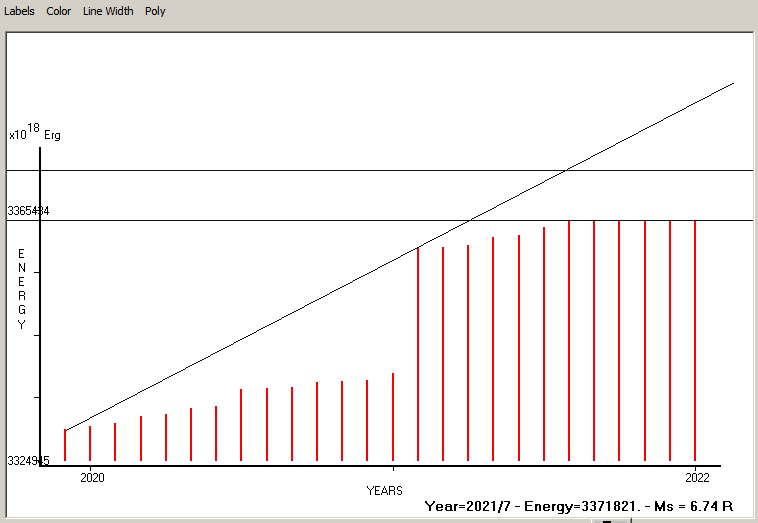
Fig. 9. Expected EQ magnitude due to application of the LSEFM (Lithospheric Seismic Energy Flow Model) on past (since 2020) seismic history of the regional seismogenic area.
Contact us at : gthanding@gmail.com