
Short-term Earthquake Prediction Based on Seismic Precursory Electric Signals Recorded on Ground Surface.
|
|
“What today seems impossible, is tomorrow’s reality”
Dinos
M 4.8 NEW JERSEY, USA 2024-04-05 14:23:20 UTC (USGS)
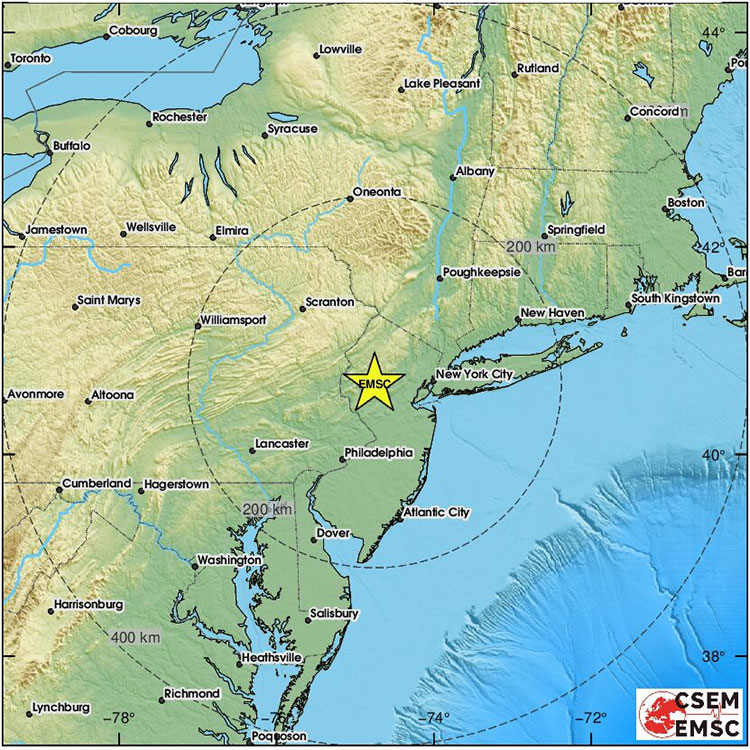
Fig. 1. EQ Location (colored star, after EMSC).
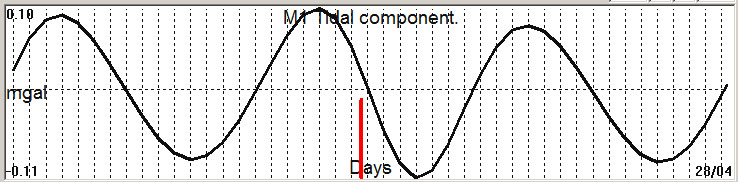
Fig. 2. M1 tidal variation (black line) v.s time of occurrence (red bar) of the EQ.
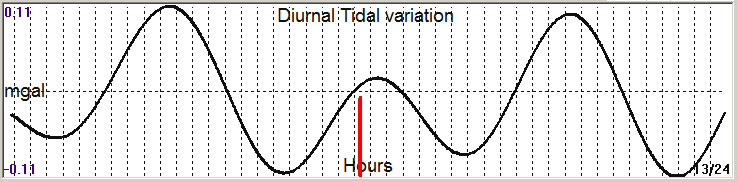
Fig. 3. Diurnal (K2) tidal variation (black line) v.s time of occurrence (red bar) of the EQ.
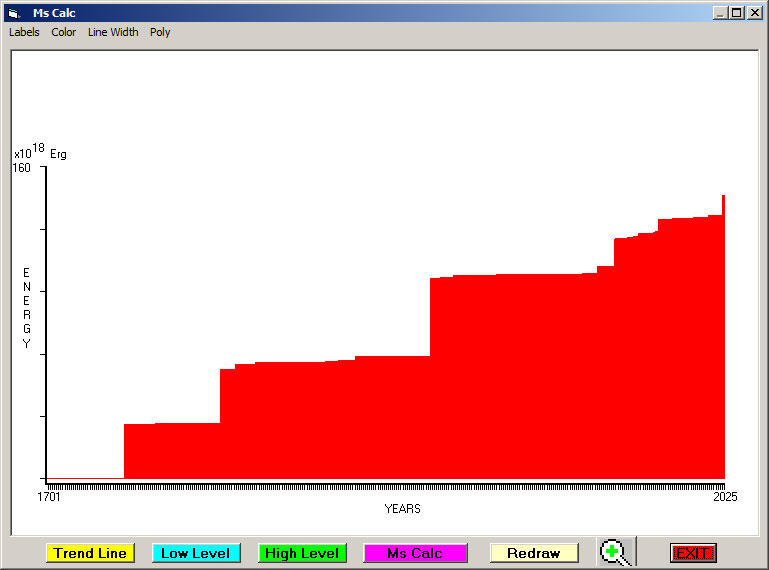
Fig. 4. Cummulative Seismic Energy Release (CSER) since 1701 in 1 month sampling interval.
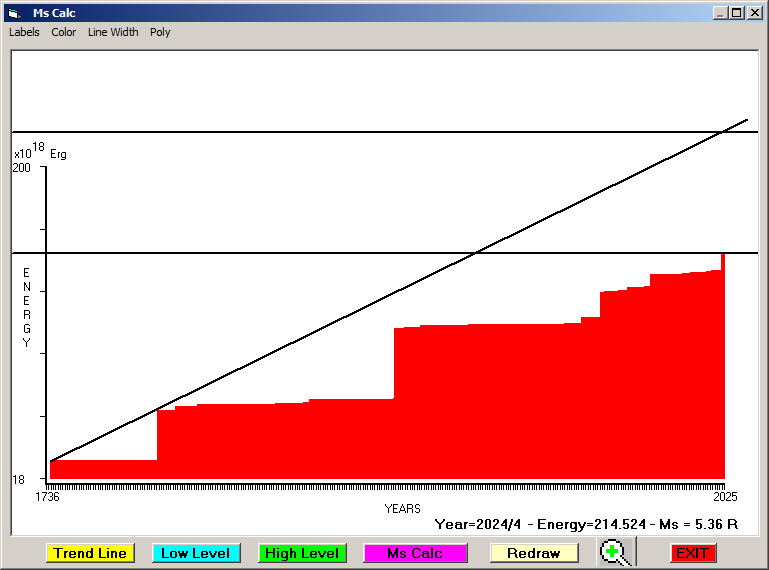
Fig. 5. Expected EQ magnitude due to application of the LSEFM (Lithospheric Seismic Energy Flow Model) on past (since 1736) seismic history of the regional seismogenic area.
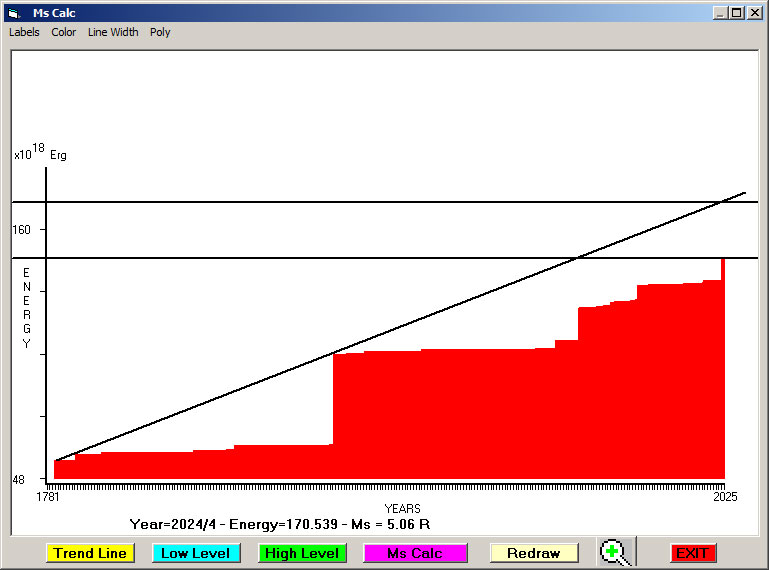
Fig. 6. Expected EQ magnitude due to application of the LSEFM (Lithospheric Seismic Energy Flow Model) on past (since 1781) seismic history of the regional seismogenic area.
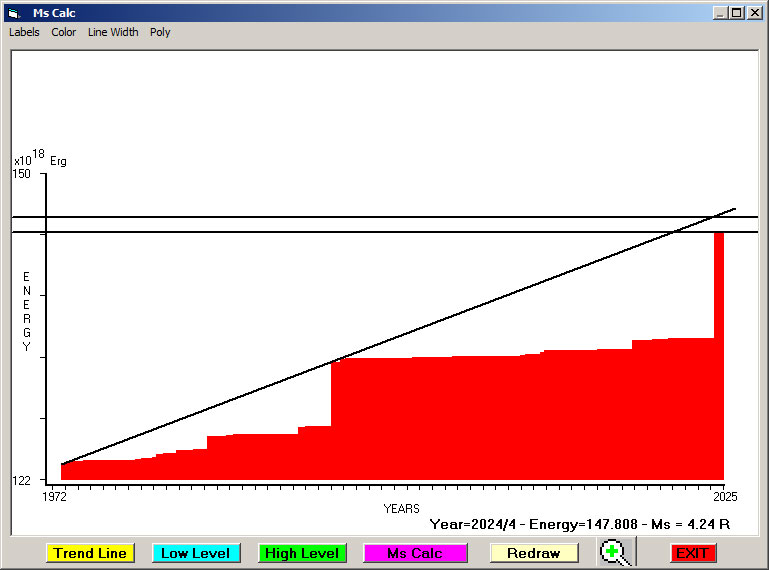
Fig. 7. Expected EQ magnitude due to application of the LSEFM (Lithospheric Seismic Energy Flow Model) on past (since 1972) seismic history of the regional seismogenic area.
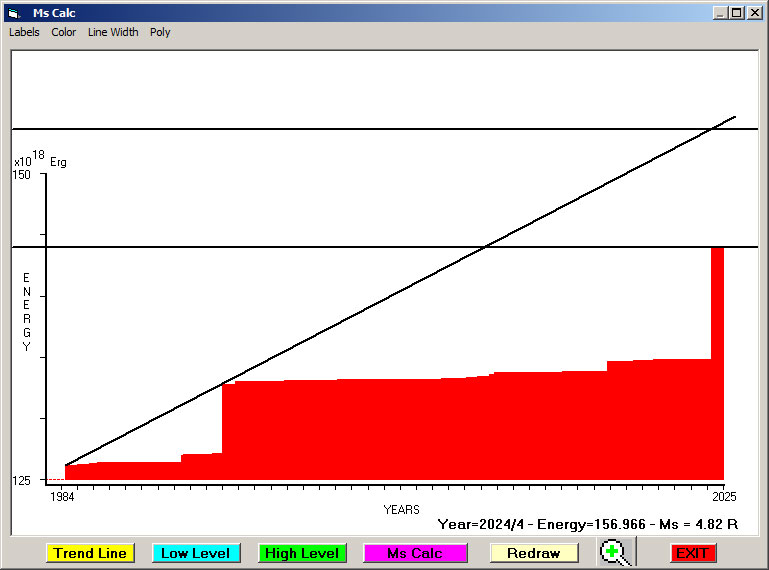
Fig. 8. Expected EQ magnitude due to application of the LSEFM (Lithospheric Seismic Energy Flow Model) on past (since 1984) seismic history of the regional seismogenic area.
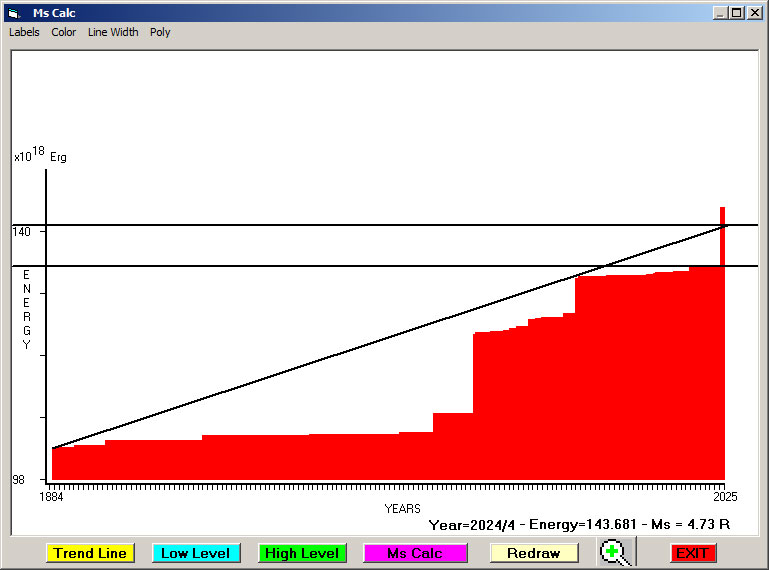
Fig. 9. Expected EQ magnitude due to application of
the LSEFM (Lithospheric Seismic Energy Flow Model) on past (since
1884) seismic history of the regional seismogenic area,
if the occurrence
time of the earthquake was known.
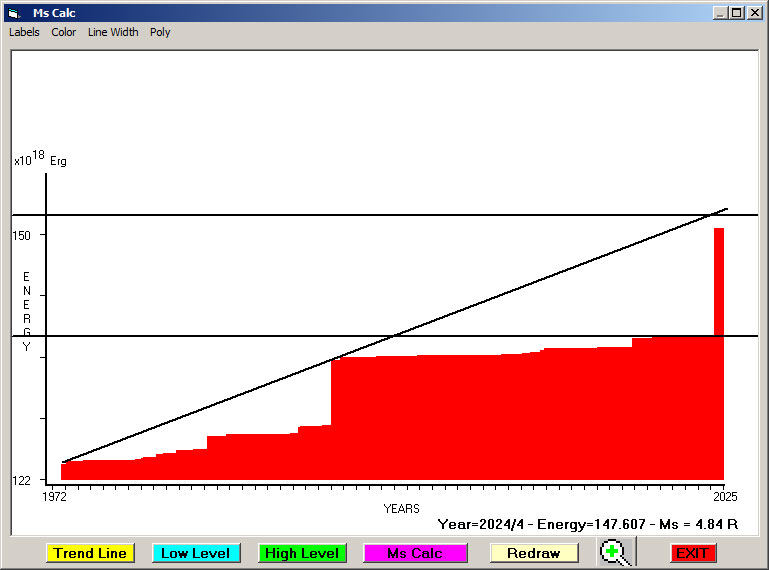
Fig. 10. Expected EQ magnitude due to application of
the LSEFM (Lithospheric Seismic Energy Flow Model) on past (since
1972) seismic history of the regional seismogenic area,
if the occurrence
time of the earthquake was known.
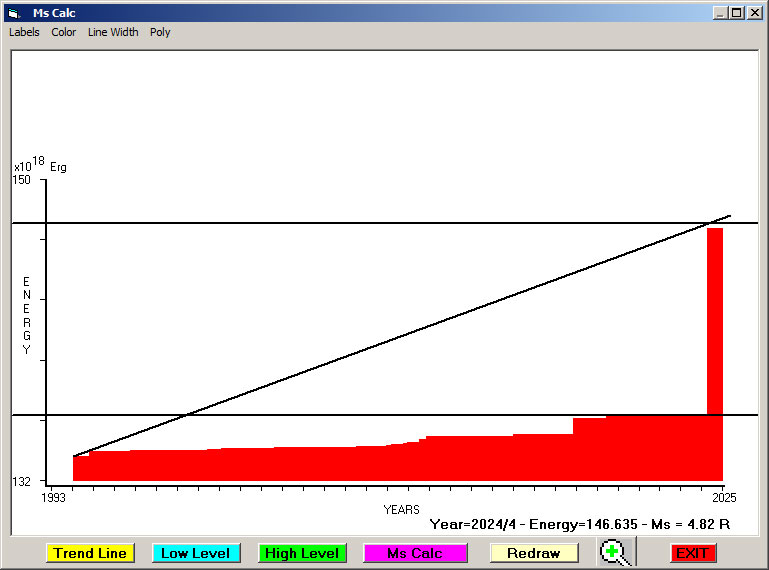
Fig. 11. Expected EQ magnitude due to application of
the LSEFM (Lithospheric Seismic Energy Flow Model) on past (since
1993) seismic history of the regional seismogenic area,
if the occurrence
time of the earthquake was known.
Contact us at : gthanding@gmail.com