
Short-term Earthquake Prediction Based on Seismic Precursory Electric Signals Recorded on Ground Surface.
|
|
“What today seems impossible, is tomorrow’s reality”
Dinos
M 6.1 - CENTRAL MID-ATLANTIC RIDGE - 2022-02-08 11:59:27 UT

Fig. 1. EQ Location (colored star, after EMSC)
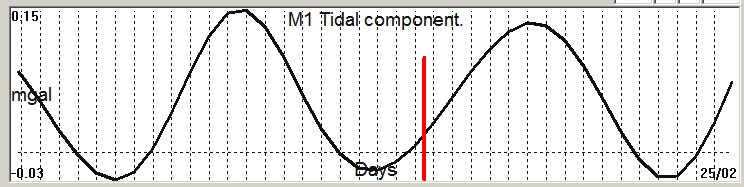
Fig. 2. M1 tidal variation (black line) v.s time of occurrence (red bar) of the EQ.
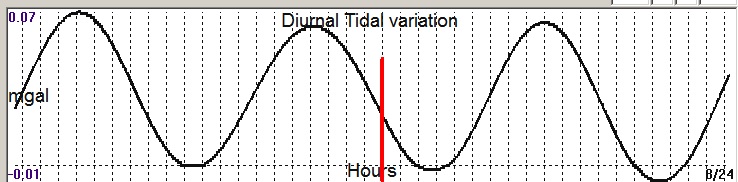
Fig. 3. Diurnal (K2) tidal variation (black line) v.s time of occurrence (red bar) of the EQ.
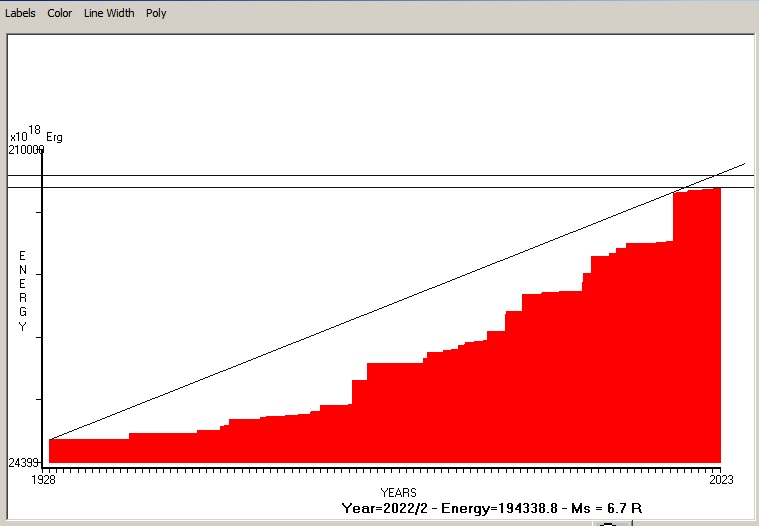
Fig. 4. Expected EQ magnitude due to application of the LSEFM (Lithospheric Seismic Energy Flow Model) on past (since 1928) seismic history of the regional seismogenic area.
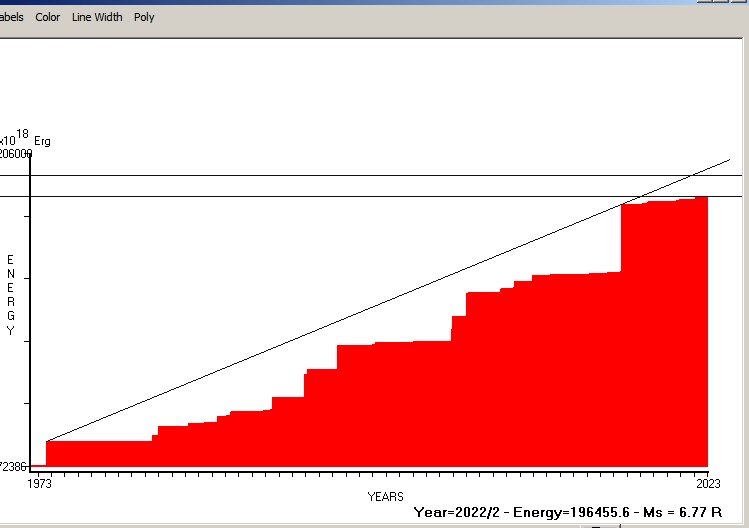
Fig. 5. Expected EQ magnitude due to application of the LSEFM (Lithospheric Seismic Energy Flow Model) on past (since 1973) seismic history of the regional seismogenic area.
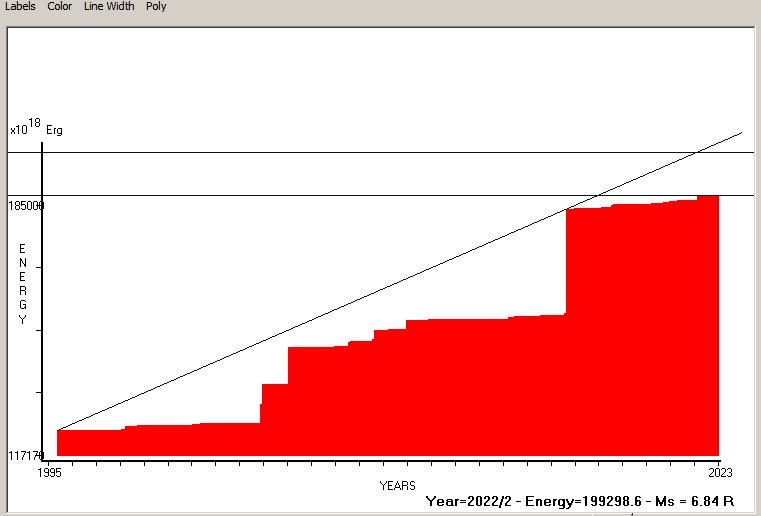
Fig. 6. Expected EQ magnitude due to application of the LSEFM (Lithospheric Seismic Energy Flow Model) on past (since 1995) seismic history of the regional seismogenic area.
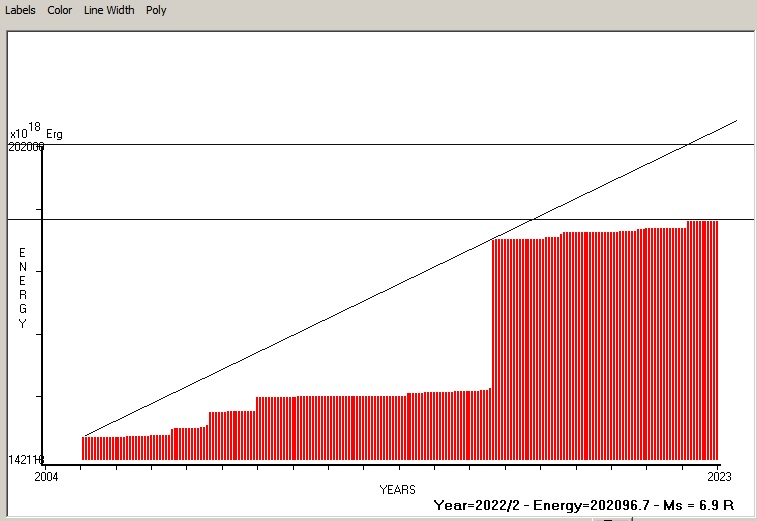
Fig. 7. Expected EQ magnitude due to application of the LSEFM (Lithospheric Seismic Energy Flow Model) on past (since 2004) seismic history of the regional seismogenic area.
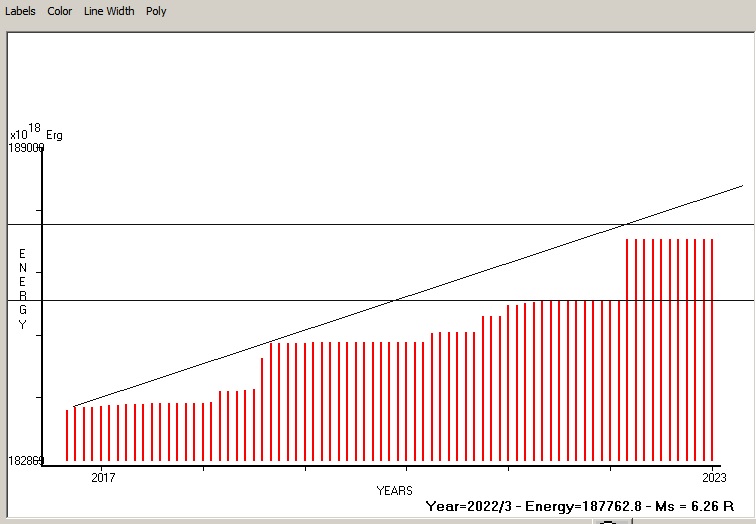
Fig. 8. Expected EQ magnitude due to application of the LSEFM (Lithospheric Seismic Energy Flow Model) on past (since 2016-7) seismic history of the regional seismogenic area.
Contact us at : gthanding@gmail.com